Contour lines help geologists (as well as hikers) understand the slope of the land. Each
line represents the elevation at that line. If you were to walk across a line, you are
changing elevation. The steeper the slope, the more lines you will cross in a short
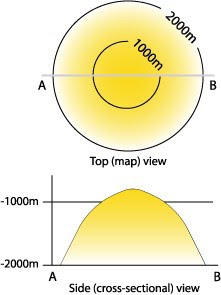 distance
Figure 34 – Contour Mapping
This concept of contour lines also works
under ground. Just like rocks above ground
can be seen to be bent, forming anticlines
(domes) or synclines (saddles), these
structures extend beneath ground. Therefore,
if the geologist understands what the
structure of the layers of rock underground
look like (either by well data or geophysical
evidence such as seismic reflections), he or
she can draw a contour map which represents
this structure
Above ground, contour lines represent elevations, or heights. Below ground, the numbers
represent depths BELOW the surface. Therefore, a 1,000 meter contour line equals a
depth of 1000 meters (or NEGATIVE 1,000 meters), and would actually be higher than
the 2,000 meter contour.
(To be more accurate, generally, subsurface contours are mapped relative to a SEA
LEVEL datum, so even below the ground's surface you can have positive contour values,
and only get negative values when the contour depth is below sea level.)
Contour maps
Maps that represent surfaces in terms of a series of curves. An individual curve
represents a part of the surface along which the surface "value" is constant. Topographic
contour map: contour lines represent points of equal elevation of the ground surface.
Structure contour map: contour lines represent points of equal elevation along a geologic
surface (e.g., the top of a geologic unit) that commonly is buried. If the values of a
structure contour map are subtracted from the values on a corresponding topographic map, the difference gives the depth from the ground surface to the top of the geologic
unit.
Isopach contour map: contour lines represent points of equal thickness of the geologic
unit
Given a data set (x, y, z), one can prepare a contour map of z (e.g., concentration of
contamination in ground water) vs. (x, y).
Geologic maps show the intersection (trace) of geologic features with the ground surface,
a surface that is generally sub horizontal but irregular (i.e., with some limited 3D
relief).
Geologic maps are not top views of subsurface features as projected into a horizontal
plane.
The strike of a geologic surface is obtained by determining the azimuth between two
points on the geologic surface that have the same elevation (i.e., that lie along the
intersection of the geologic surface and a horizontal plane).
A strike view cross section is taken perpendicular to the strike of a geologic body. It
shows the true dip and true thickness of the body.
The contacts of horizontal layers parallel elevations contours.
The contacts of vertical geologic surfaces appear as straight lines on geologic maps with a
topographic base.
Most geologic structures are not ideal planes, and structure contours on these structures
are often neither straight nor equally-spaced. In fact, structure contours can violate many
of the rules we are familiar with on topographic maps.
· Geologic structures often have overhangs; hence structure contours can cross.
Actually the contours themselves do not cross, only their projections on the map.
· Geologic structures often have discontinuities in the form of faults. Structure
contours can terminate and not close.
In the example we consider here, we will be concerned only with data that is fairly wellbehaved:
smooth, with no overhangs or discontinuities. The problem is very similar to
contouring topographic data.Rules for Construction
· Structure contours must still be parallel to the strike of a structure at every point.
· Keep the contours as simple as possible consistent with the data.
· Keep the contours smooth. Do not show abrupt changes in curvature or spacing
unless you have sound geologic reasons to do so.
· Interpolate only between nearby points
· If the structure is only gently curved, you may find it useful to approximate the
structure as a series of plane segments at first. For each group of three data points,
construct structure contours using the three-point method. Make sure the triangles
are as nearly equilateral as possible. Once the contours are constructed, draw the
final contours as smoothly as possible using the construction as a guide.
· You will often have surface or near-surface data and little or no data at great
depth. In such cases, your contours will be little more than guesses to suggest the
three-dimensional form of the structure. Such contours are called form lines. In
cases like this, you have no choice but to extrapolate surface data to deep levels
and use your knowledge of geologic structures as a guide.
Example
1. Contour the data shown
2. Interpolate between
nearby points. Avoid
extremely long-distance
interpolations.
3. Sometimes it pays to
treat the data as a series of
three-point problems.
4. Once you have a clear
mental picture of the
structure, construct smooth
contours to fit the data.
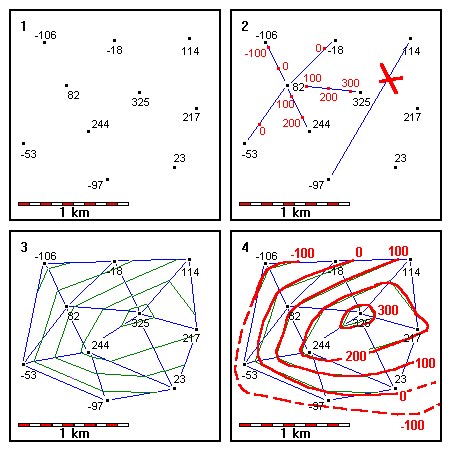
Figure 35 – Example of structure contouring
· Note that some of the data are negative. It is perfectly possible to have data points
below sea level when analyzing data from deep wells or when drawing form lines
on large, deep structures.
· If you treat the data as a series of three-point problems, contours within each
triangle must join the corresponding contours in neighboring triangles.
· When drawing the smoothed contours, the contours must be consistent with the
data points but need not be perfectly consistent with points estimated by
interpolation. A data point at 210 meters elevation must be located on the uphill
side of the 200 meter contour. But interpolated points are only estimates of the
elevation of the structure. Trying to fit all the interpolated points exactly may
result in contours that are overly erratic. Worse yet, it may create the impression
of spurious detail - a user of the contour map may be misled into thinking the
undulations in the contour are real features of the structure. It's better to draw
smooth contours that are as consistent as possible with both the interpolations and
with other contours.
· Note that the 0 and -100 contours are extended into areas of no data, based on the
overall shape of known contours. We can be fairly sure the -100 contour passes
just outside the -97 data point, but elsewhere, there is little control on the exact
locations of these contours. These are examples of form lines. We expect them to
be roughly correct, but do not expect high precision from them.
No comments:
Post a Comment