A log of a well is a determination of downhole properties relative to depth. Many types of
logs are run in a borehole, depending upon the information desired and equipment
available. Typical logs run are electric logs, magnetic logs, sonic logs, radioactive logs
and physical logs of various types. Properties measured by these logs may include
pressure, temperature, rock density, porosity, permeability, fluid saturations, magnetic
properties, radioactive properties and sonic velocity. In most instances more than one log
is run simultaneously during a logging run.
The Spontaneous Potential (SP) log
The spontaneous potential tool measures natural electrical potentials that occur in
boreholes and generally distinguishes porous, permeable sandstones from intervening
shales. The "natural battery" is caused when the use of drilling mud with a different
salinity from the formation waters, causes two solutions to be in contact that have
different ion concentrations. Ions diffuse from the more concentrated solution (typically
formation water) to the more dilute. The ion flow constitutes electrical current, which
generates a small natural potential measured by the SP tool in millivolts.
When the salinities of mud filtrate and formation water are the same, the potential is zero
and the SP log should be a featureless line. With a fresher mud filtrate and so, more saline
formation water, a sandstone will show a deflection in a negative potential direction (to
the left) from a "shale base line" (Figure 8). The amount of the deflection is controlled by
the salinity contrast between the mud filtrate and the formation water. Clean (shale-free)
sandstone units with the same water salinity should show a common value, the "sand
line". In practice, there will be drift with depth because of the changing salinity of
formation waters. The displacement on the log between the shale and sand lines is the
"static self-potential" SSP.
Although they record different physical properties, the two logs are comparable because
of their sensitivities to shale and so both can be used to differentiate between sandstones
and shales. The stronger sandstone differentiation at greater depths on the SP log is caused by greater salinities in the deeper sandstones.
.
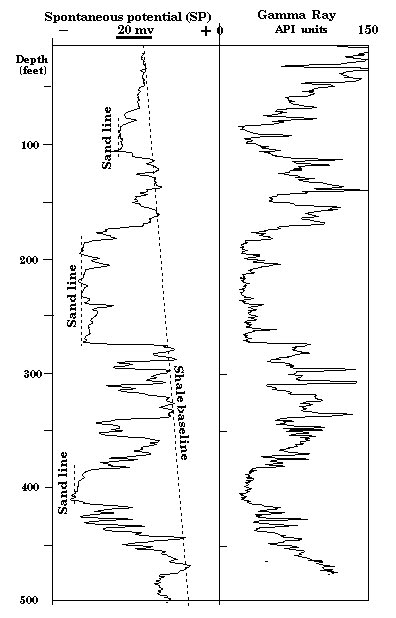
Figure 35. Spontaneous potential (SP) and gamma-ray log from KGS Jones #1.
The SP log in Figure 35 is an example taken from a shallow section of the Dakota. Notice
how the shale baseline shows a distinctive drift with depth. This characteristic is
commonly observed in shallow sections and has been suggested to be caused by increases
in relative oxidation of the rocks that are close to the land surface. The highest sandstone
in the well has a muted deflection on the SP log as compared with the lower sandstones.
This contrast is an immediate indication that water in the upper sandstone may be
significantly fresher than waters of the lower sandstone. In other wells it is not
uncommon to see sandstone units where the SP deflection goes to the right of the shale
baseline. In these instances, the drilling mud filtrate is saltier than the formation water. A
good example of this phenomenon is shown in Figure 9 from a well in north-west Kansas. In the upper sandstone, "U", the SP log shows a deflection to the right, indicating
formation water to be fresher than the drilling mud, while in the lower sandstone, "L", the
deflection is to the left, showing the formation water to be more saline.
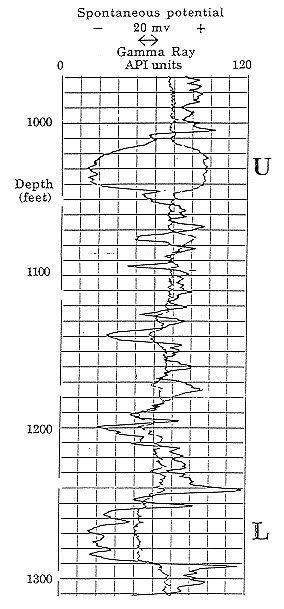
Figure 36. Spontaneous potential (SP) and gamma-ray logs of the Dakota Aquifer in
Cities Service Montgomery #2 CNENW 7-8S-23W, Graham County, Kansas.
Note that the SP log deflects to the right in the upper sandstone, "U," but to the left in the
lower sandstone "L." This "reversal" occurs because the formation water in the upper
sandstone is fresher than the drilling mud, but saltier than the drilling mud in the lower
sandstone.
The conductivity of the drilling mud filtrate is measured by the engineers at the well-site
and recorded on the "header" of the log. This information combined with the SSP "battery
effect" shown on the log can be used to estimate the conductivity of the formation water.
The calculation is made very commonly by petroleum log analysts as an important
variable in the search for potential oil or gas zones. When used to
evaluate the quality of aquifer waters, care must be taken to ensure realistic conclusions.
Although formation water compositions at greater depths tend to be mostly sodium
chloride, the ions of calcium, magnesium, bicarbonate and sulfate become more
important in shallow, aquifer waters. As a result, the equations used by petroleum log
analysts are only approximate and must be adjusted to honor the ionic mix of the local
aquifer water. In general, the divalent ions of shallow waters tend to make them appear
slightly more saline than they actually are when computed from the SP log.
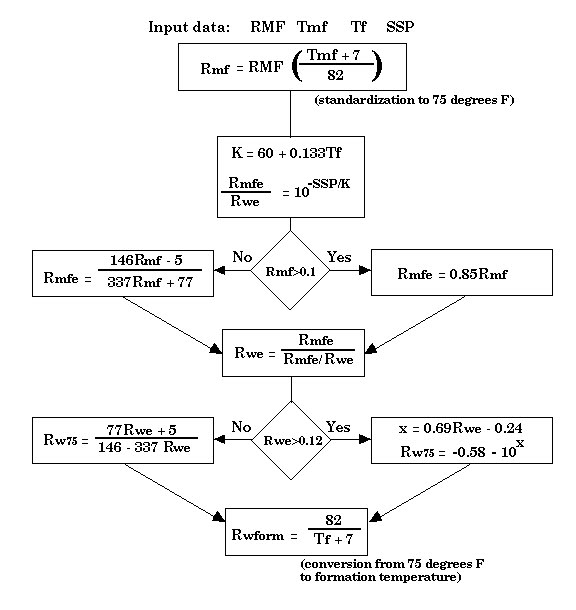
Figure 37. Flow chart from oil-industry log analysis to estimate formation water
resistivity, Rw, in deep formations from the SP log (Bateman and Konen, 1977).
RMF is mud filtrate resistivity measured at temperature Tmf and recorded on the log
header; Tf is the temperature of the formation, generally estimated by interpolating
between the bottom-hole temperature (BHT) at total depth (TD) and mean annual
temperature at the surface; SSP is the static self-potential measured on the log between
the "clean line" and "shale line" in millivolts (mv) AND with associated sign (positive or
negative).
An empirical chart was developed as part of the research in the Dakota to correct
apparent water resistivities calculated from standard equations to estimates of real
resistivities measured in Dakota Aquifer water samples (Figure 38). The corrected
resistivities were then transformed to estimates of total dissolved solids. The method is
particularly useful in Dakota Aquifer studies because it allows water quality studies to be
extended beyond wells from which Dakota water samples were taken to wells that were
unsampled but logged with an SP device.
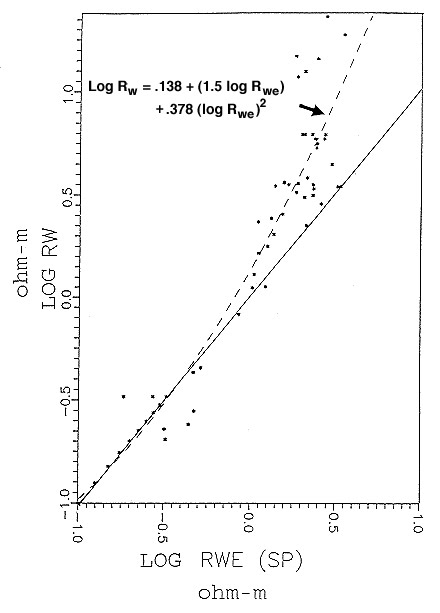
Figure 38. Custom-designed chart and function to convert apparent water resistivity
(Rwe) calculated from oil-industry algorithms to actual resistivity (Rw) of Dakota
Aquifer waters.
The correction is necessary because Rwe is calculated with the assumption that the
dissolved solids in the water are from a single salt; actual Rw values will be controlled by
the ionic mix of natural waters, and discrepencies with Rwe will be particularly noticable
in the relatively fresher waters of shallow formations. From Boeken (1995).
TheResistivity log
Resistivity logs measure the ability of rocks to conduct electrical current and are scaled in
units of ohm-meters. There is a wide variety of resistivity tool designs, but a major
difference between them lies in their "depth of investigation" (how far does the
measurement extend beyond the borehole wall?) and their "vertical resolution" (what is
the thinnest bed that can be seen?). These characteristics become important because of
the process of formation "invasion" that occurs at the time of drilling. In addition to its
other functions, drilling mud forms a mudcake seal on the borehole wall of permeable
formations.
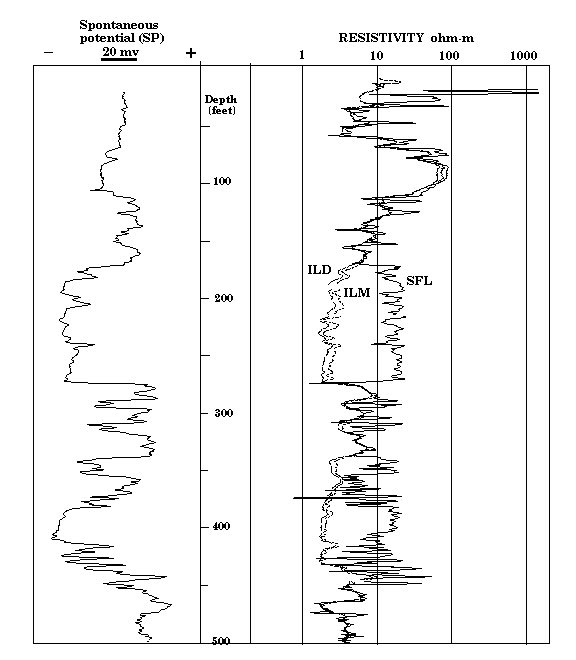
Figure 39. Spontaneous potential (SP) spherically focussed (SFL) medium- (ILM) and
deep- (ILD) induction resistivity logs from KGS Jones #1.
However, in doing this, some mud filtrate penetrates into the formation, displacing
formation water and this is called "invasion". The replacement of formation water by
mud filtrate involves a change of pore water resistivity.
The difference between the resistivity log measurements and the invasion process can be
seen on Figure 12, where separation between the curves can be seen in the more porous
and permeable sandstones, but minimal separation in the shales which are effectively
impermeable. From a hydrologic perspective, the multiple resistivity curves are therefore
excellent discriminators of aquifer and aquitard units. The mud used in the example well
was less saline than formation waters in the deeper units, as is common in many drilling
operations. The shallowest reading resistivity device (in this case, the spherically focused
log) therefore records the highest resistivity because it responds mostly to formation
invaded by the higher resistivity mud filtrate.
The two induction logs draw their responses from deeper in the formation, so that the
deep induction log (ILD) probably records a reading close to the true resistivity of the
undisturbed formation. Notice that the resistivities in the uppermost sandstone (depth,
100 feet) are contrasted with those in the lower sandstones by showing a much reduced
separation. As observed already, the dampened deflection of this sandstone on the SP log
shows that its contained water is only slightly more saline than the drilling mud, and
much less saline than the lower sandstones. Therefore, invading mud filtrate is only
slightly fresher than the connate water, so that invasion effects on the resistivity logs are
masked.
The sensitivity of resistivity logs to water salinity can be used in an alternative method to
SP log estimates of water quality. In a sandstone-shale sequence, resistivity variation is
controlled by a variety of phenomena, including cation-exchange mechanisms by clay
minerals within the shalier zones, conduction by metallic minerals, and the dissolved ions
within the pore water of the sandstones.
However, formation water resistivity may be calculated in shale-free sandstone zones that
are logged by resistivity and porosity tools. The water resistivity (Rw) is calculated from
the resistivity and porosity log readings by the Archie equation (Archie, 1942) that
incorporates a "cementation factor" (m) expressing the tortuosity of the pore network as a
modifier to the fractional volume of pore space (F):
Rw = Ro x F**m
where Ro is the resistivity reading of the zone when it is completely saturated with water
whose resistivity is Rw. The method is widely used by log analysts in the oil industry and
generally gives good estimates of water resistivity in deeper (more saline) formation
waters. Results are less reliable in aquifers because of clay mineral effects as well as
surface conduction on quartz grain surfaces.
A water resistivity/specific conductance curve was computed for the Dakota Aquifer in
the Jones well using the Archie equation with a cementation exponent (m) of 1.6 (an
appropriate value for a slightly cemented sandstone). The water resistivity curve is shown
in Figure 40 and is indexed with two water sample measurements and a reference value
from Rattlesnake Creek.
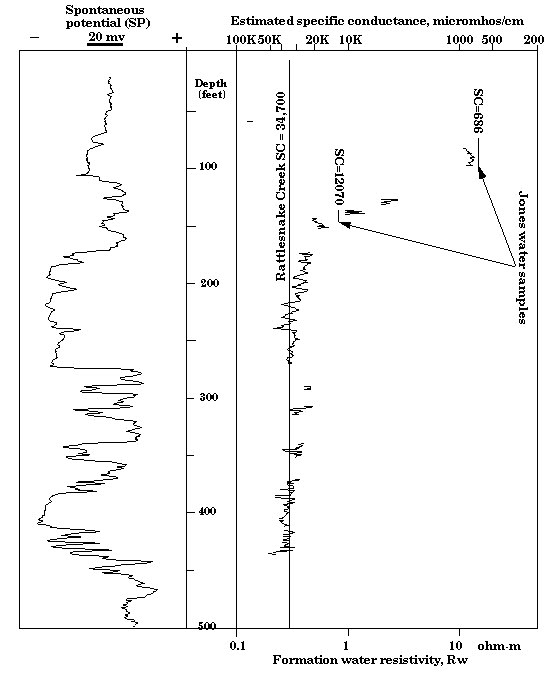
Figure 40 - Spontaneous potential (SP) log and profile of specific conductance of
formation water estimated from resistivity and porosity logs in KGS Jones #1.
indicated by the gamma-ray log. The estimated specific conductance trace is a highly
acceptable match with sample measurements and appears to show a transition zone
between the fresher water of the upper sandstone and the more saline waters of the lower
sandstones.
Note match between profile and conductances measured from well water samples.
Again, it must be emphasized that log estimates of water quality should only be used (and
then with caution) where no samples are available for direct analysis. In each case, the
log property is an indirect measure, because it records a physically dependent property,
rather than water salinity itself. In addition, rock properties other than water salinity may
contribute to overall conductivity effects. The accuracy of the estimates degrades as water
salinity decreases, with a general rule of a bias to pessimism in overpredicting salinity in
fresher waters. However, when used judiciously with water chemical measurements, log
data estimates are valuable in extending knowledge of Dakota Aquifer water quality over
larger geographic areas and greater depth ranges.
The "Porosity" logs
There are three types of logging tools that are used to estimate the amount of pore space
in a rock: the neutron, density, and acoustic velocity (or sonic) tool. Although either one
or several of these types of logs are commonly run in oil exploration holes that penetrate
the Dakota, they are not always recorded in the Dakota interval. Commonly, a full suite
of logs is recorded in the deeper section, where there is a potential for oil and gas up to
the level of the Permian Stone Corral. Above the Stone Corral, a more restricted suite
may be run to be used for correlation purposes, and typically consists of the gamma-ray,
SP, and resistivity logs.
The neutron log records counts of the collisions between neutrons that radiate from a tool
source and hydrogen atoms within the rock of the borehole wall. So, the log is mainly a
measure of hydrogen concentration (mostly contained by the pore fluids of the
formation). Older neutron logs are recorded in counts that require conversion to porosity
units either by calibration to units of known porosity within the logged section or by
reconciliation with cored samples from the same well. Newer neutron logs are scaled
directly in units of porosity (Figure 41). Shales appear to have high porosities on the
neutron log, mostly because of bound water, rather than effective porosity. However,
porosities recorded in shale-free sandstones are a reasonable estimate of pore spaces that
contain water that can be produced in a well.
A "limestone scale" is normally, because oil exploration targets below the Dakota are
usually limestone. Actual prosoities in the sandstones will be about 3% higher. The
porosity reflects "free" water in the sandstones, but bound water in the shales.
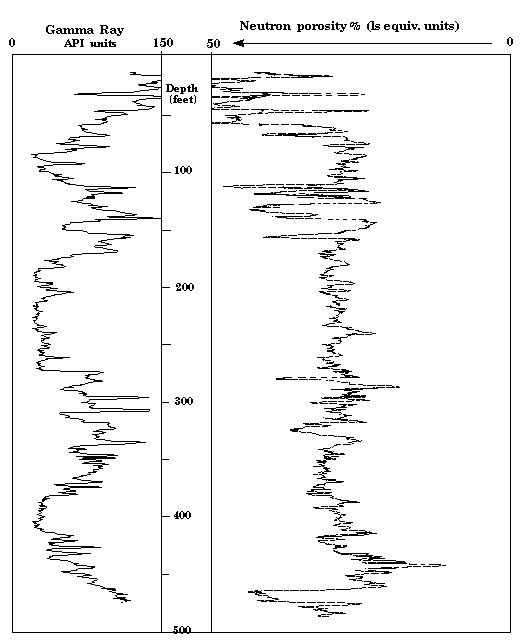
Figure 41. Neutron porosity log from KGS Jones #1. Note that porosity increases from
right to left.
The density log is a measure of apparent density of the rock and is computed from the
absorption of gamma rays emitted from a tool radioactive source by the formation. An
example of a density log run in the Dakota is shown in Figure 42. The density of quartz is
about 2.65 grams per cubic centimeter, and that of water is approximately 1.0. These two
values correspond to the density of a sandstone with zero porosity and a hypothetical
sandstone with a porosity of 100%. The two limits can be used to convert the density curve of the photoelectric factor is also recorded, and is a useful measure of formation
mineralogy.
Newer density logs commonly have a photoelectric factor curve which is a useful
lithology discriminator.
scale to values of equivalent porosity units. On more recent density logs, a supplementary curve of the photoelectric factor is also recorded, and is a useful measure of formation
mineralogy.
Newer density logs commonly have a photoelectric factor curve which is a useful
lithology discriminator.
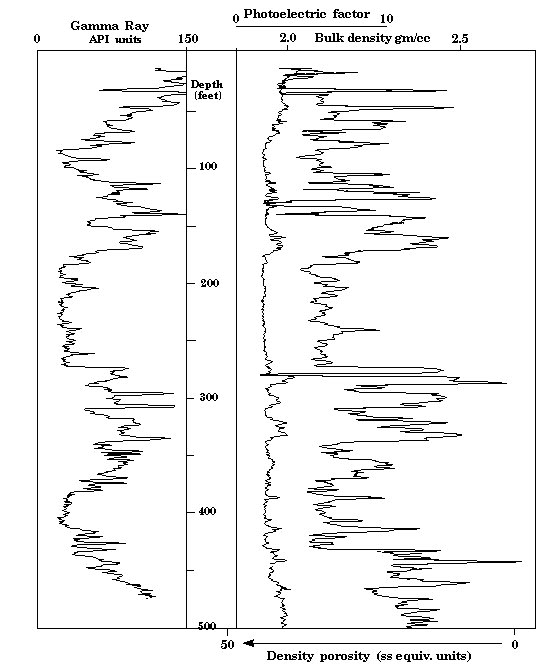
Figure 42. Density log from KGS Jones #1 recorded in grams per cc (upper scale) and an
equivalent sandstone scale (lower scale).
It is common to see both the neutron and density logs recorded on the same logging run
and shown as an "overlay" on a common scale of equivalent limestone porosity units (see
Figure 6). The overlay allows shales, sandstones, and other lithologies to be distinguished
and a better estimate to be made of the true porosity of the formation at any depth. The
log overlay has sufficient information to be converted to a profile that graphically shows
shale content and volume of effective pore space (Figure 7). Notice that the overall shale
composition estimated from the density-neutron log combination is similar to shale
indicated by the gamma ray log. but there are also systematic differences. The reason is,
that while both measurements are sensitive to shale content, the gamma ray log responds
to the natural radioactivity of the shale, while the neutron-density logs are influenced by
the bound water and density of the shales.
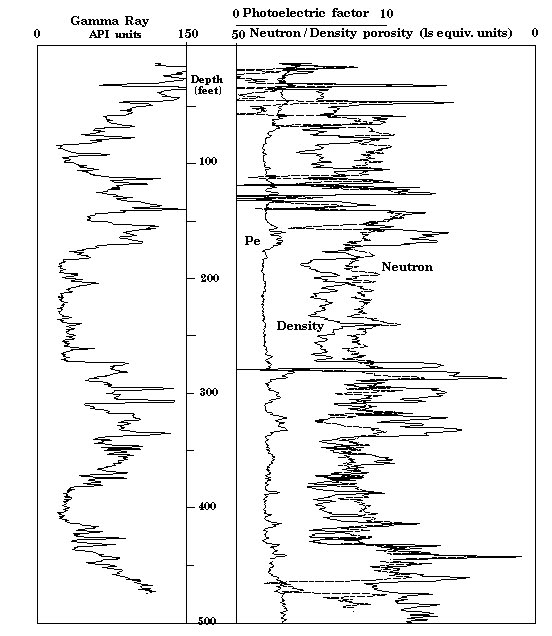
Figure 43. Neutron and density logs from KGS Jones #1 overlaid on a common
equivalent limestone scale.
The overlay allows the log analyst to recognize lithologies and read values of true
porosity in zones of interest.
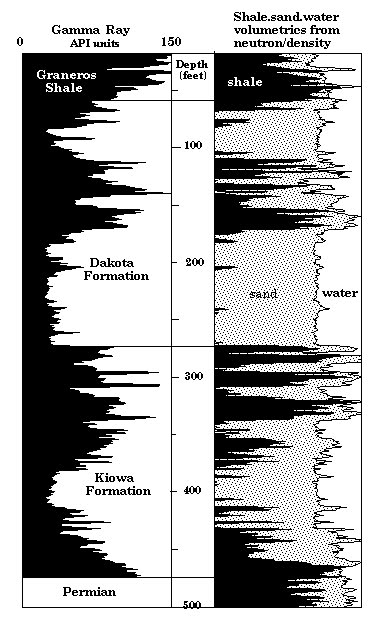
Figure 44. Volumetric summary of shale, quartz, and pore space indicated by gamma-ray
and lithodensity-neutron logs from KGS Jones #1.
Note that shale estimation by the gamma-ray log is based on natural radioactivity and
shows slight differences with shales from the lithodensity and neutron logs which are
based on shale bound water and density characteristics.
The third type of porosity estimate is computed from measurements of the speed of
ultrasonic sound through the formation. The sonic tool has a mechanical source of
compressional energy that radiates sound through the rock formation in the borehole wall.
The log records the acoustic velocity of the rocks as a trace which is shown as a
continuous function of depth. The log is measured as transit time in units of
microseconds per foot. Sound travels faster in rocks with low amounts of contained fluids
than those with higher contents of fluid. This physical relationship can be used to
compute the porosity of a sandstone at any depth, by interpolating the measured value at
any depth between the expected value of quartz (55.5 microseconds per foot) and that of
water (189 microseconds per foot) as extremes of a porosity scale of zero to 100%
porosity.
The sonic log is widely used by geophysicists to create synthetic seismograms for
comparison with field records of seismic reflections from lines shot close to the well.
Observations from drill-cuttings and logs at the well site allow the geology in the
borehole section to be established. Therefore, reflection events on the synthetic
seismogram can be tagged with specific rock formations and used as a key to identify
reflections on field records. Some exploratory seismic field studies were made by Coyle
(1990) to determine what units in the stratigraphic section that contains the Dakota
Aquifer could be resolved as distinct reflections and whether seismic shooting could be
used in exploration for thick Dakota sandstones.
No comments:
Post a Comment